
Team Shares
Rethinking Benchmarks
A behind-the-scenes look at the most popular benchmarking utilities, and what their results really mean for your workload.
Editor’s note: This article addresses Pro Data performance from a single device. To learn how to increase performance even further using multiple devices, see our follow-on article Fast Friends.
Almost everyone considering an equipment upgrade uses benchmarks to determine the cost-to-benefit ratio, because hardware investments need to pay off – most of all professionally. Reviewers publish performance stats to give potential buyers a basis for comparison, but do we really know what they mean?
The challenges for reliable storage benchmarks come in many forms, first and foremost that each utility takes a different approach, producing results that can vary widely. Here are four typical results:
16″ MacBook Pro (2019) Internal 2TB SSD1
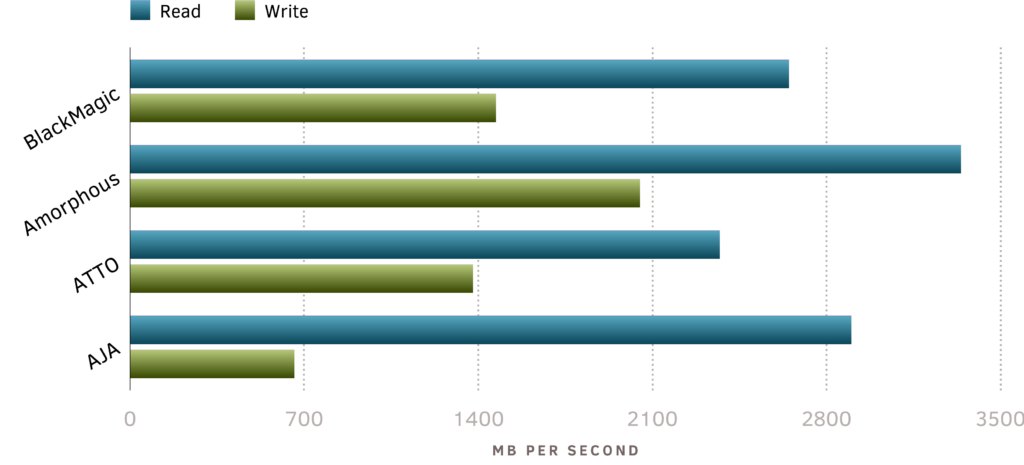
What’s going on here? How can Amorphous report to read so much faster, and why are AJA’s writes so slow? Imagine paying for the promise of “up to” performance, and not getting anywhere close to those numbers. Clearly more is at play than just speed.
While our engineering team has spent decades tuning storage performance, you shouldn’t need a graduate course to get the gist. Instead, let’s unpack a few key factors that affect results behind the scenes, then reexamine how we might consider benchmarks in making storage investments.
Behind the big “GO” button
As storage nerds, we typically test using the open-source and highly-configurable Linux utility “fio” (Flexible I/O Tester) to ensure the best possible performance across a wide range of workloads. Below are our results for both an unformatted device and an APFS-formatted volume.
Pro Data fio Benchmark Results2
M2 Max MacBook Pro, macOS 14.2 Sonoma, Pro Data firmware version 1.4
Unformatted 16GB I/O total, queue depth=8, 256KB blocksize
Single Path (R/W MBps)Multi-Path (R/W MBps)RAID-0RAID-6RAID-0RAID-6
| 3100 / 1900 | 3100 / 1500 | 5200 / 2400 | 5400 / 1800 |
Apple Filesystem 16GB I/O total, queue depth=8, 1MB blocksize
Single Path (R/W MBps)Multi-Path (R/W MBps)RAID-0RAID-6RAID-0RAID-6
| 3100 / 1800 | 3100 / 1500 | 5200 / 2300 | 5300 / 1800 |
The multi-path results above show the effects of our unique Thunderbolt NVMe Multipathing, with two Thunderbolt cables connected to Pro Data to reach even higher performance levels.
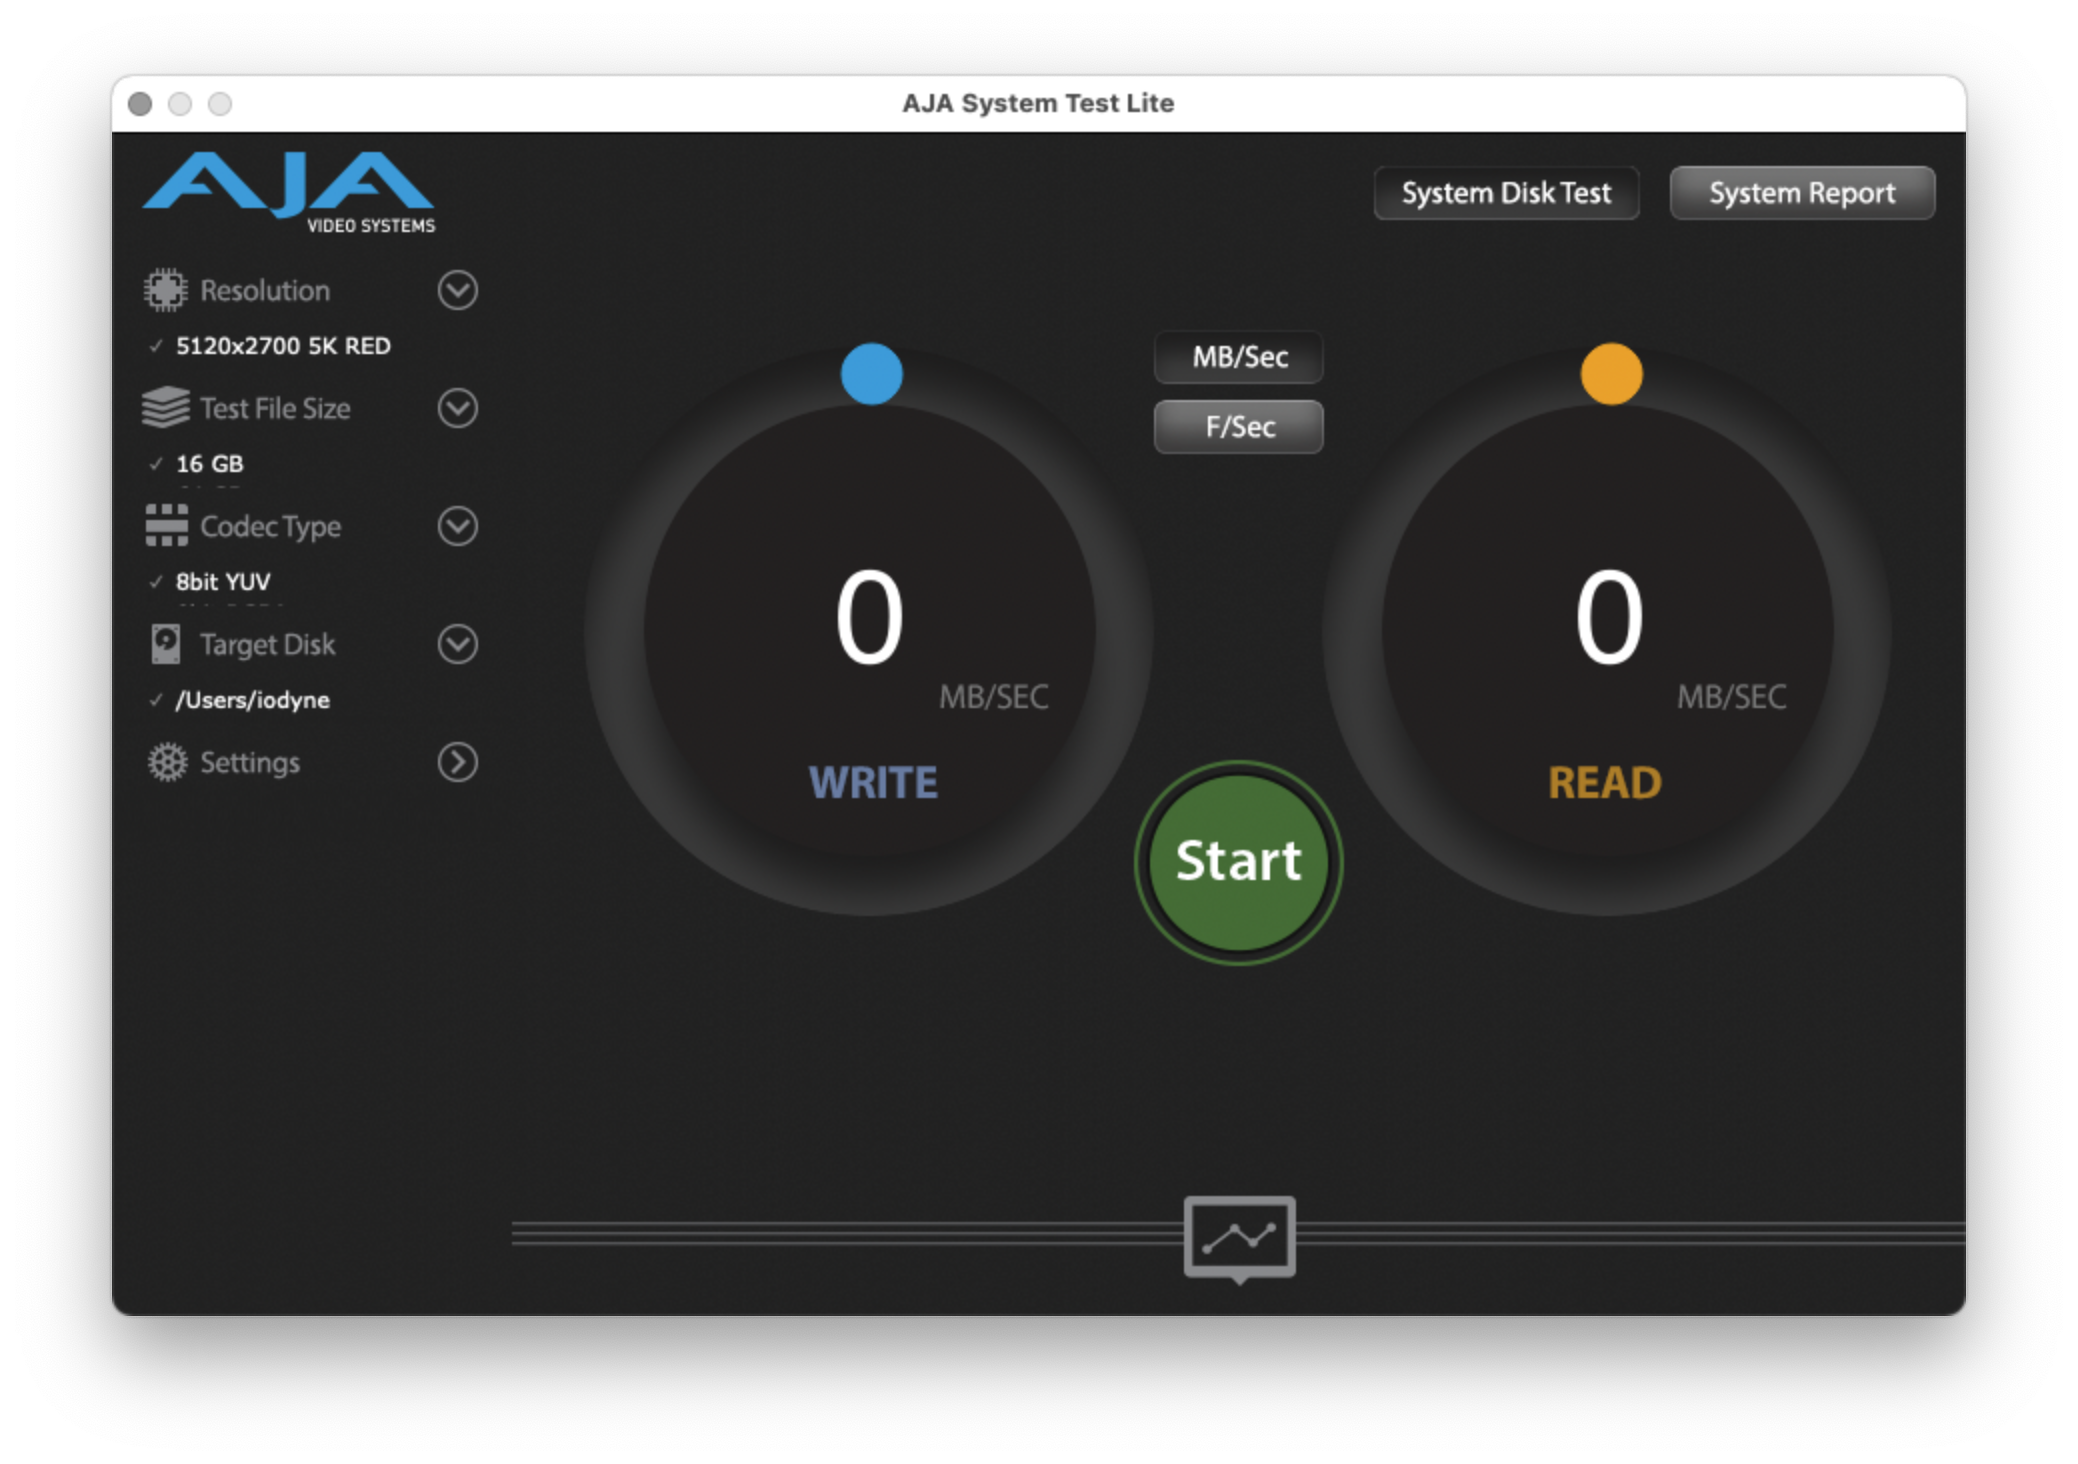
Of course, not everyone loves the command line, so we went down the GUI benchmark rabbit hole, and there were met by the big GO button.
Typical benchmarks don’t tend to give much insight into what is being measured, or provide tunable properties that can simulate real-world workloads. In profiling Pro Data, our goal quickly shifted to demystifying why results vary so widely by measuring the following key factors that affect storage performance during testing.
Blocksize and Alignment. These refer to the amount of data read/written for each operation, and how well that size aligns with on-media logical block addresses (LBA). Most storage devices are assigned an LBA of 4KB due to a legacy of smaller file sizes, however this means that most files are broken up into many more blocks, which can flood the command queue, explained further below. Different benchmarks use different block sizes and alignments, which accounts for part of the variation seen above, and may not match the sizes used by your workload.
Concurrency. Applications make read/write requests to a storage device in batches; the number of requests in a batch is commonly referred to as queue depth, representing the number of requests a device can receive at a time. When a storage device cannot either process or buffer these threads of batched commands as quickly as they are made, then performance degrades. Peak SSD storage performance is always going to be achieved with a highly concurrent workload, such as playback of multiple 4K video streams.
When a benchmark utility stresses a storage device to see how well it can keep up with multiple requests, the above factors are tweaked to simulate what it assumes is a typical workload. The issue here is not only with transparency, but with the synthetic nature of the simulation. In other words, nothing simulates a workload better than having real applications perform common tasks. We’ll explore why that matters below.
Nothing simulates a workload better than having real applications perform common tasks.
Here’s a look at how Pro Data measures up using the macOS GUI benchmarks cited above, on both RAID-0 and RAID-6 containers with our latest firmware:
Pro Data Benchmark Results3
M2 Max MacBook Pro, macOS 14.2 Sonoma
Single Path (R/W MBps)Multi-Path (R/W MBps)
RAID-0RAID-6RAID-0RAID-6
| BlackMagic | 2400 / 1900 | 2400 / 1500 | 3600 / 2400 | 3600 / 1800 |
| Amorphous | 3100 / 1800 | 3100 / 1500 | 5150 / 2250 | 5400 / 1750 |
| ATTO | 3100 / 1900 | 3100 / 1500 | 5100 / 2300 | 5200 / 1800 |
| AJA | 2700 / 1800 | 2700 / 1500 | 4400 / 2300 | 4500 / 1700 |
Here we continue to see the breakthrough performance of iodyne’s revolutionary NVMe multipathing. However, as before, different approaches to benchmarking deliver vastly disparate results. Even less helpful, these benchmarks typically measure in very short intervals – hardly reflective of professional workloads that require exponentially longer runtimes. So how can we translate this raw data into actionable information? We can begin to approach real-world results by looking at sustained performance.
We’ve worked hard to ensure that Pro Data delivers outstanding sustained performance, not just short-lived burst performance. The graph below shows Pro Data’s sustained performance measured against popular USB and Thunderbolt external drives, as measured independently by StorageReview and AnandTech.
Sustained Performance
128K sequential writes. Sources: StorageReview, Anandtech (1, 2, 3)
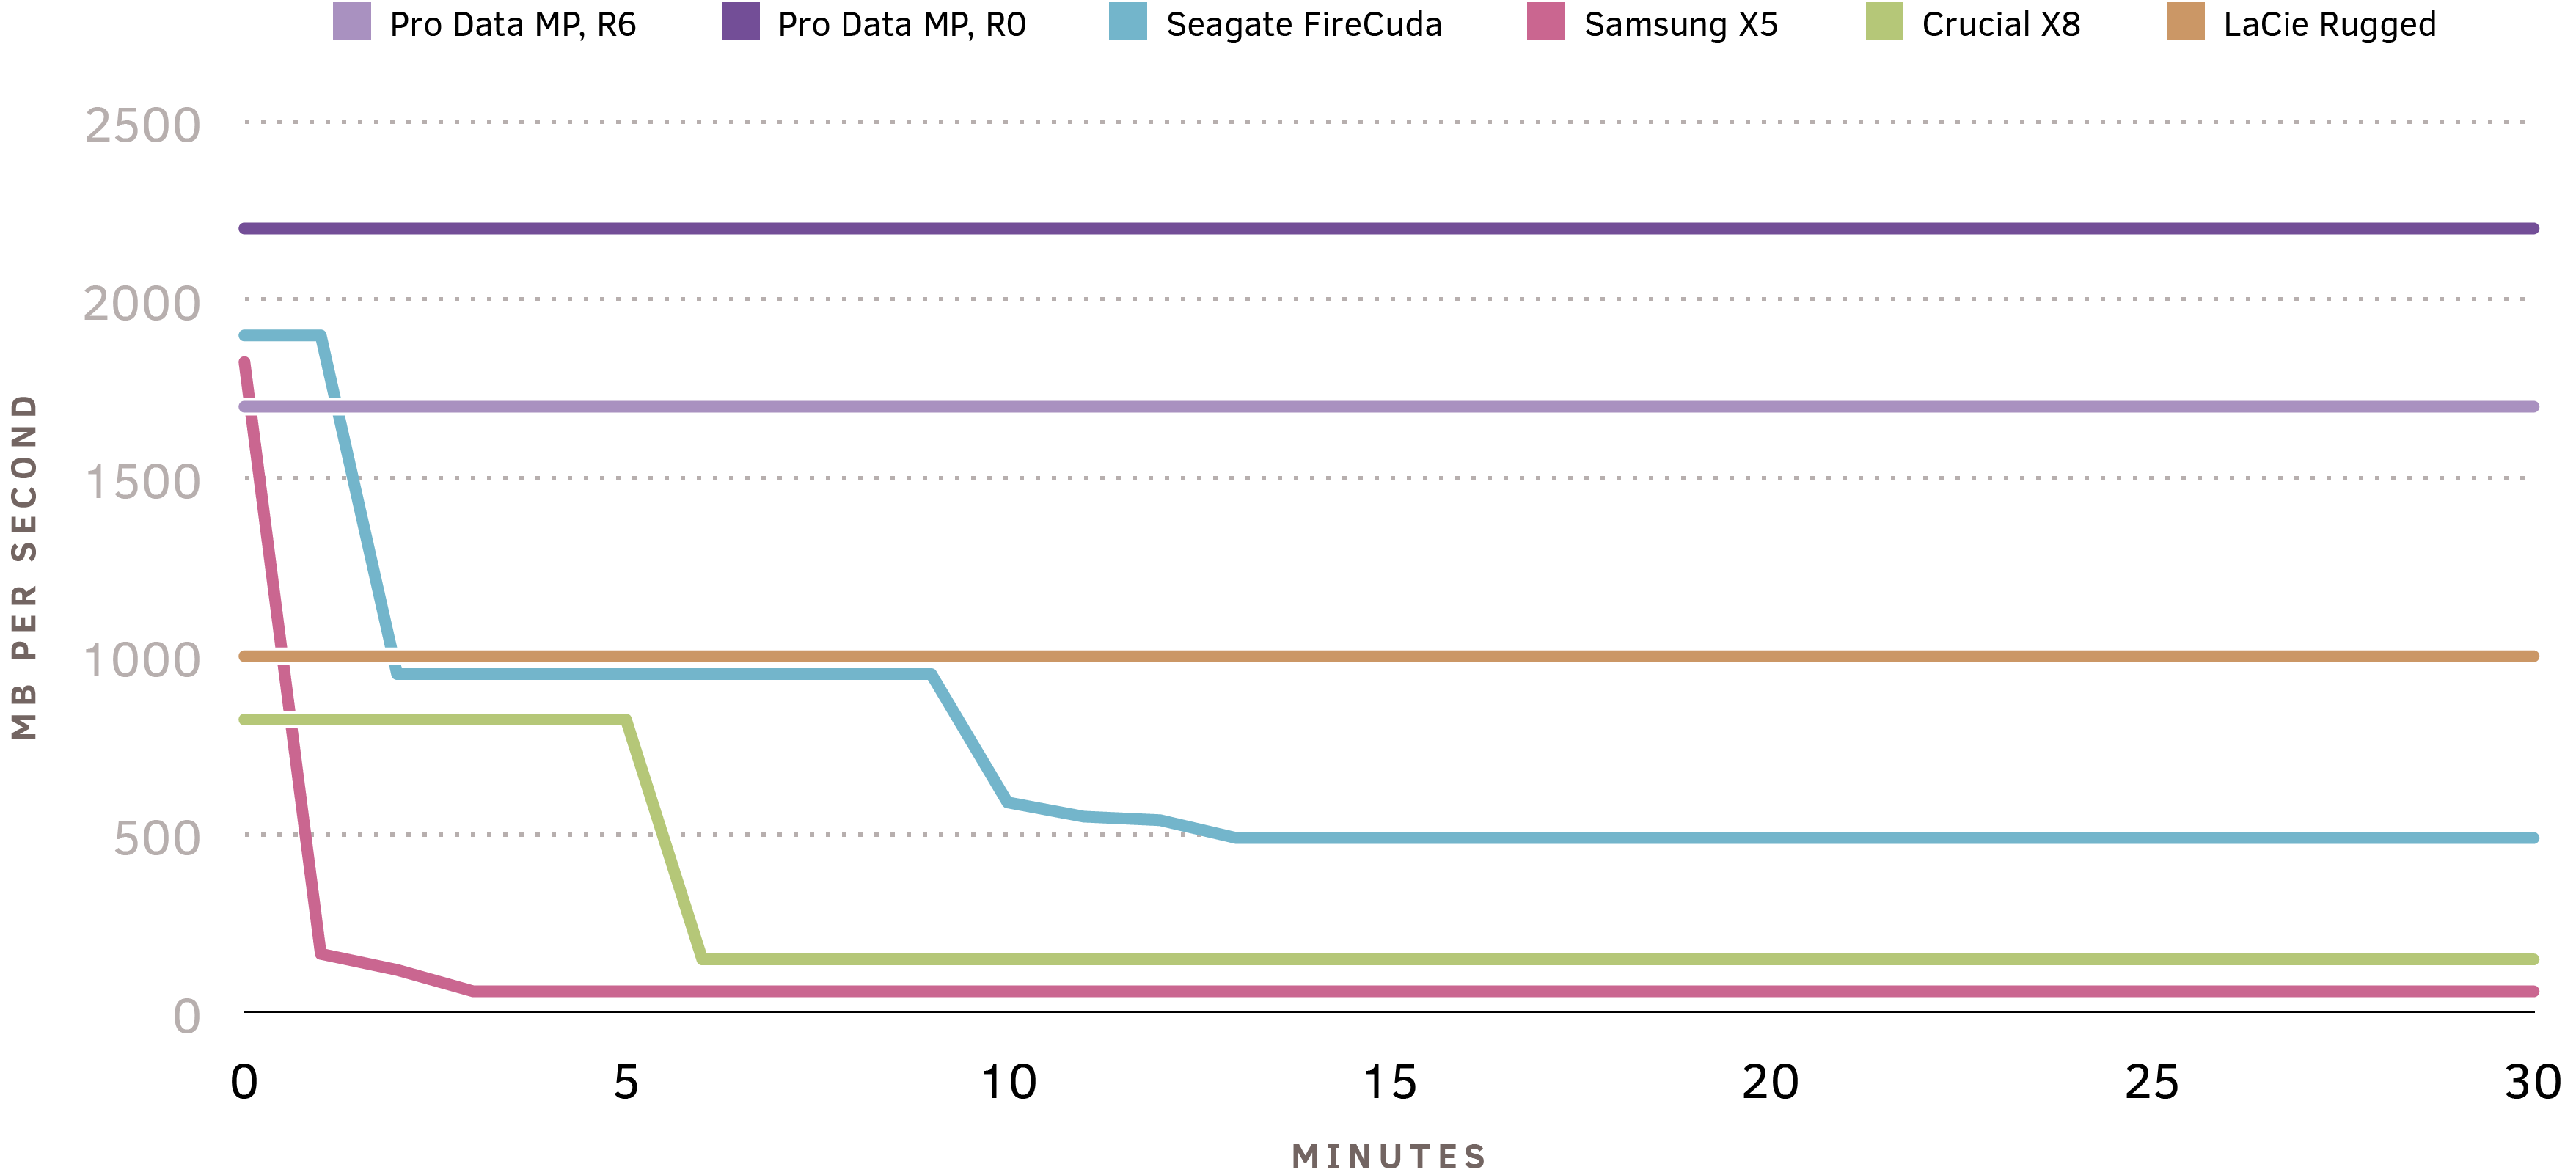
You can see the massive difference in sustained performance delivered by Pro Data’s pool of SSDs over a sustained workload. Single SSDs typically have two performance “cliffs” – the first when the flash SLC burst buffer is exhausted, and performance drops to MLC/TLC/QLC mode, and the second when garbage collection kicks in as the drive fills. These effects are only visible in long-running sustained tests, rather than the short bursts executed by most graphical benchmark utilities. Since Pro Data transparently distributes i/o over all twelve of the SSDs in a storage pool, it doesn’t rely on small caches and burst buffers to deliver peak performance: it sustains peak performance consistently over long-running workloads.
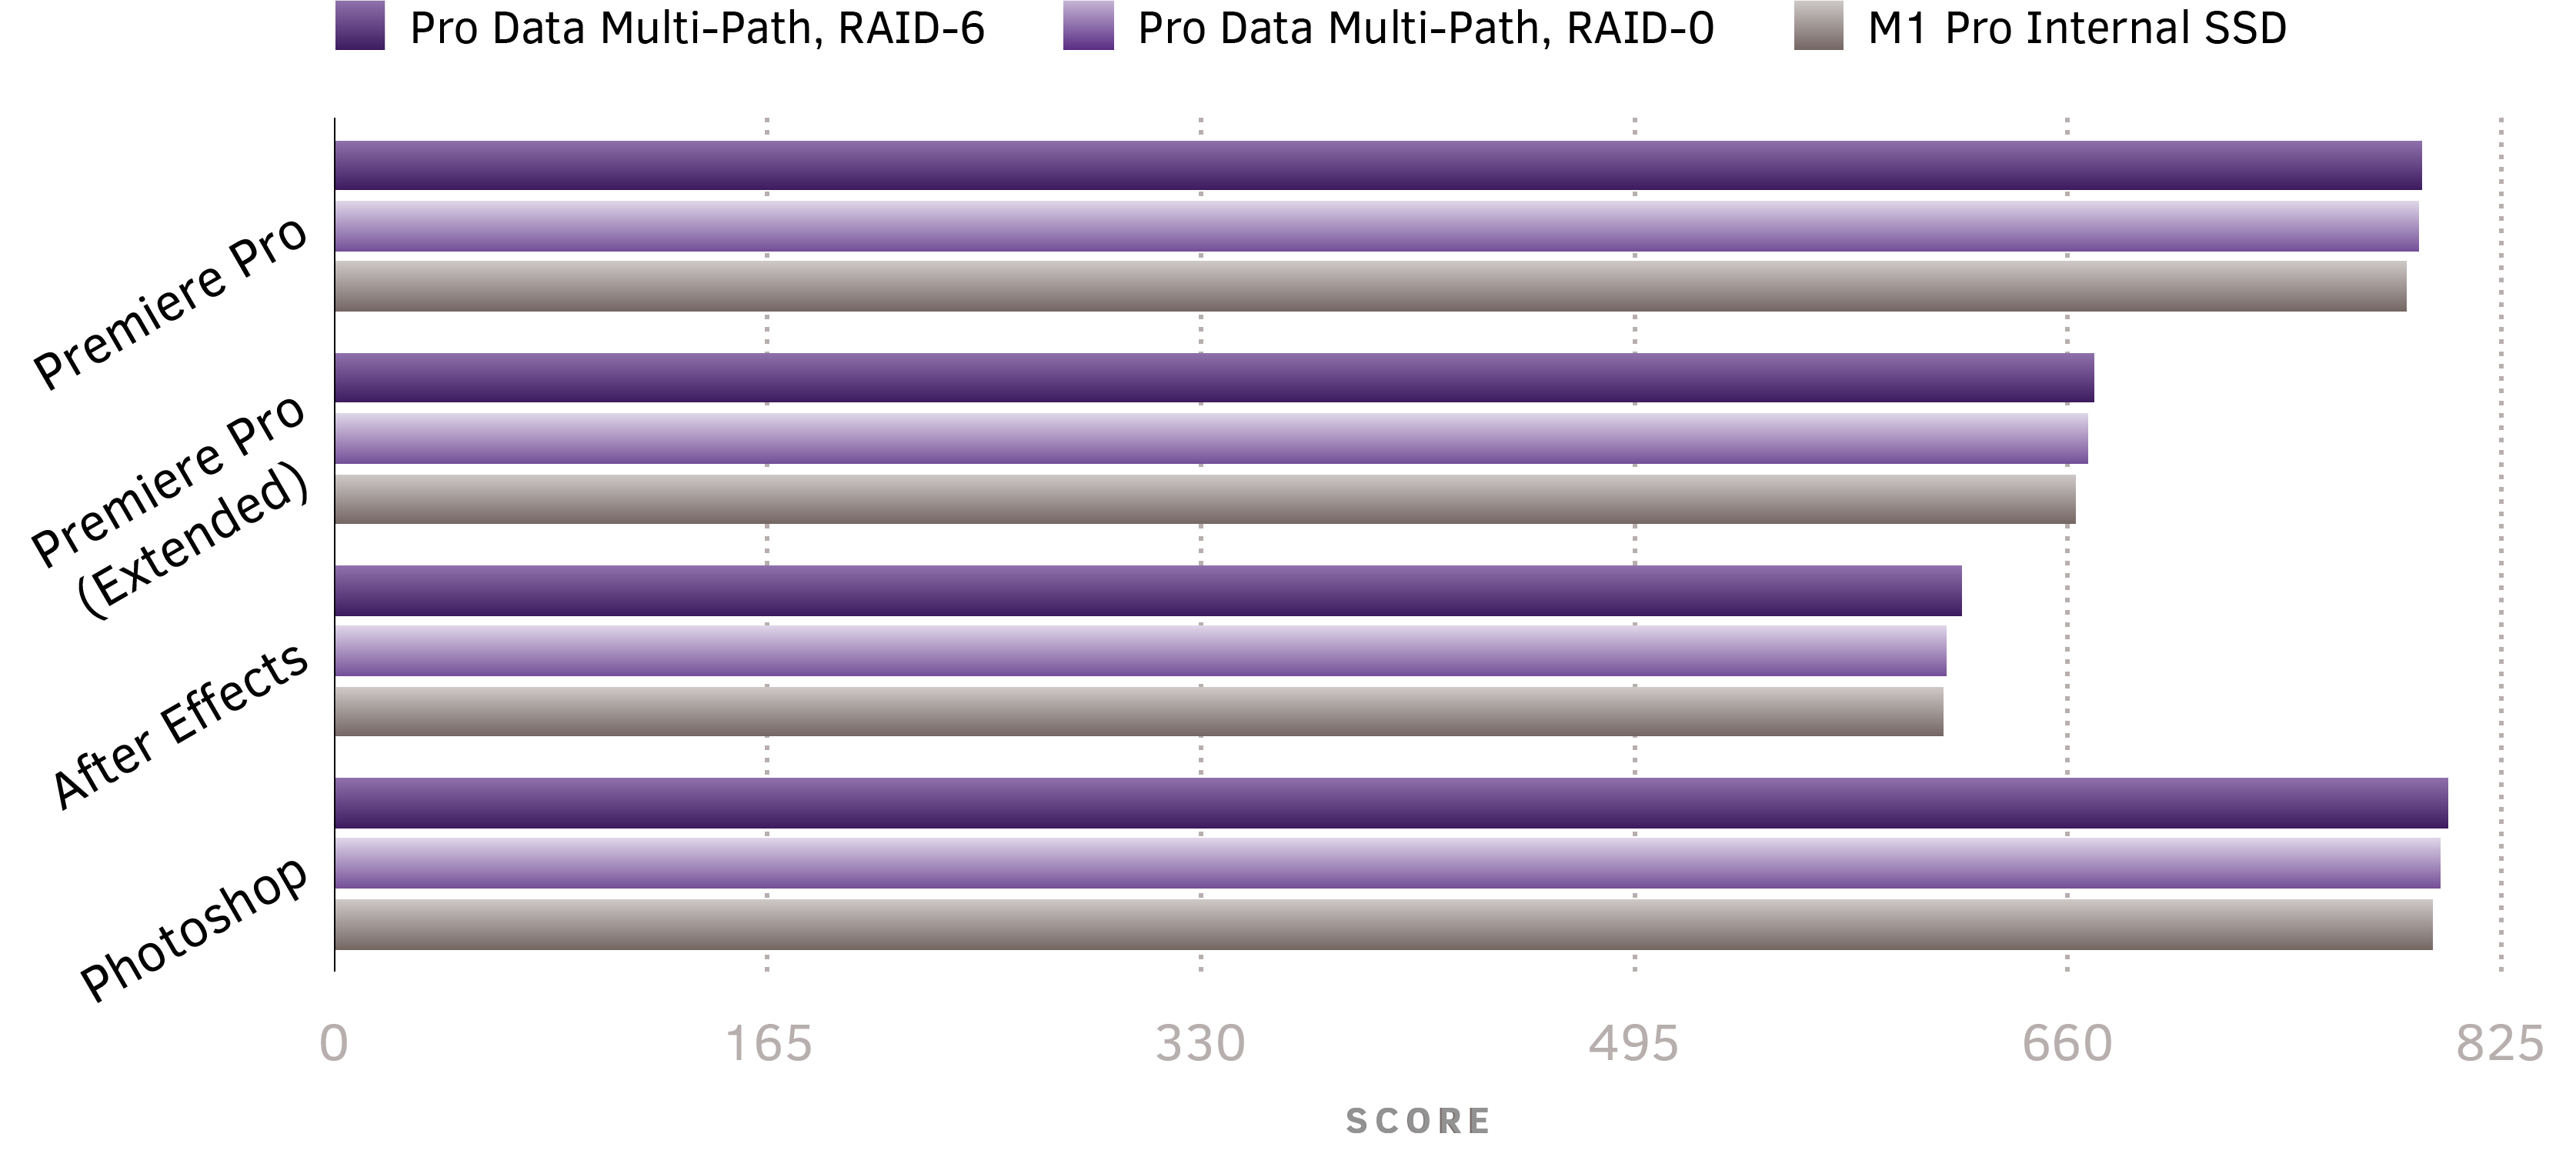
And now let’s compare the performance of Pro Data on a real workload to the fastest internal SSD on the market today: the Apple internal SSD for Apple Silicon Macs. To do this, we’ll use PugetBench, an open benchmark that runs real-world tasks on common applications including Adobe Premiere Pro, After Effects, and Photoshop. The results show that Pro Data, powered by our unique Thunderbolt NVMe Multipathing, can deliver performance on par with the fastest internal SSDs on the market, when running against real workloads powered by Apple Silicon.
PugetBench Results4
2021 M1 Pro, macOS 12.3 Monterey
Conclusion
Our pursuit of even better performance continues as we hear more reports from your experience using Pro Data. Let us know what constitutes a meaningful metric that reflects real-world performance for your workloads, what sort of tasks or suite of actions you’d like to see measured, and share your perspective on how you assess relative performance gains in a new storage product.
Revolutionary performance doesn’t stop at a single device: by combining multiple Pro Data devices into a daisy-chain, you can even scale up performance as you scale up capacity. We’ve used this technique to deliver world-record performance on APFS with Mac Studio. To learn more read our companion article, Fast Friends.
Please contact us at [email protected] if we can help you better model your workflow as part of supercharging your next project with Pro Data.
Footnotes:
- Benchmarks performed March 2022 using 2019 16-inch MacBook Pro on macOS 11.6.4 Big Sur ↩︎
- BlackMagic Disk Speed Test 3.3: 5GB
- AmorphousDiskMark 4.0: 16GB total, queue depth=8
- ATTO 1.0: 16GB total, queue depth=8, blocksize 1MB
- AJA System Test Lite 12.4.3: 16GB total, 8-bit YUV, 5K RED.
- Benchmarks performed November 2023 using M2 Max MacBook Pro on macOS 14.2 Sonoma. fio scripts used to benchmark Pro Data are available for download here, along with instructions on how to benchmark your own devices. ↩︎
- Benchmarks performed November 2023 using M2 Max MacBook Pro on macOS 14.2 Sonoma ↩︎
- BlackMagic Disk Speed Test 3.4.2: 5GB
- AmorphousDiskMark 4.0.1: 16GB total, queue depth=8
- ATTO 1.01: 16GB total, queue depth=8, blocksize 1MB
- AJA System Test Lite 16.2.3: 16GB total, 8-bit YUV, 5K RED.
- Benchmarks performed March 2022 using 2021 M1 Pro MacBook Pro on macOS 12.3 Monterey
- PugetBench 0.95.4 for Premiere Pro 22.2.0
- PugetBench 0.95.2 for After Effects 22.2.1×3
- PugetBench 0.93.3 for Photoshop 23.2.1